
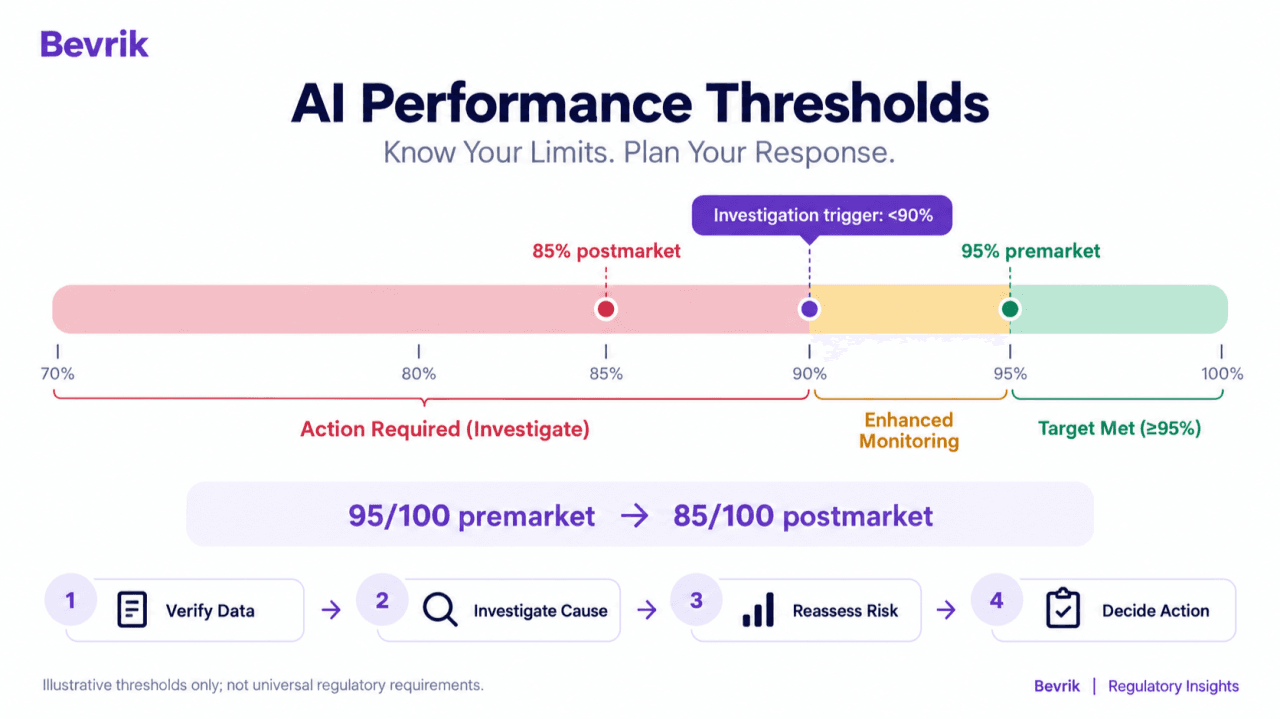
A manufacturer validates AI software that detects pulmonary nodules on chest CT scans. It correctly identifies 95 of 100 confirmed positive cases: 95% sensitivity.
Six months after launch, post-market surveillance (PMS) data from three hospitals show 85 detections among 100 confirmed positive cases: 85% sensitivity.
Has the model deteriorated? Perhaps. Differences in patient populations, CT scanners, imaging protocols and sample size could influence the results. The two percentages alone do not prove performance drift. But if the manufacturer's PMS plan specifies an investigation trigger below 90% sensitivity, the trigger has been crossed.
A performance threshold without a response plan is just a number.
Where do performance thresholds come from?
In the United States, a medical AI manufacturer supports its intended-use claims through appropriately designed validation studies. Sensitivity, specificity, false-positive rates, subgroup performance and statistical acceptance criteria must be justified for the device and its clinical risks. For example, requiring the lower bound of a 95% confidence interval for sensitivity to exceed 90% could be an acceptance rule, but it is not a universal FDA requirement.
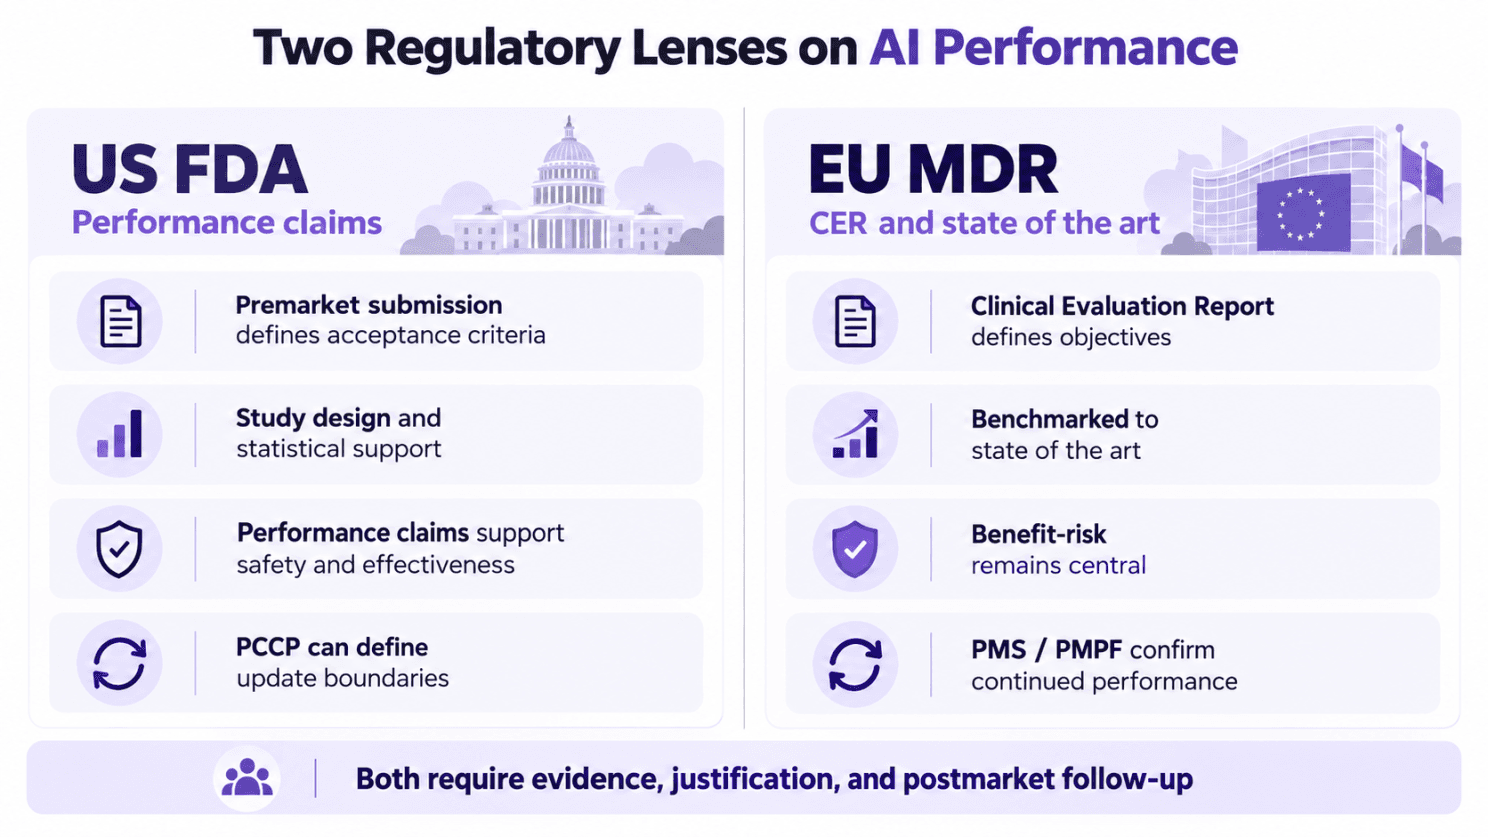
An FDA-authorized Predetermined Change Control Plan (PCCP) can also define which future AI modifications are permitted, how they will be validated and what acceptance criteria an update must meet before deployment.
Under the EU MDR, the Clinical Evaluation Plan (CEP) defines clinical objectives and methods. The Clinical Evaluation Report (CER) assesses the evidence, including state-of-the-art clinical practice and the device's benefit-risk profile. State of the art informs the performance target; it does not automatically dictate a universal percentage.
Importantly, Annex III requires PMS plans to establish suitable indicators and threshold values for continuously reassessing benefit-risk and risk management.
The intended use changes the answer
Consider how the pulmonary nodule detector is used in practice. If the software acts as a second reader, highlighting suspicious nodules while a radiologist independently reviews every CT scan, a missed detection may be identified by the radiologist. But if the software is used to prioritize scans for review, a missed nodule could delay evaluation. If it serves as the primary detection method, the consequences could be greater still.
These differences matter because 95% sensitivity is not automatically acceptable simply because it sounds high. The manufacturer must justify its performance criteria against the intended clinical workflow, available safeguards, and consequences of missed findings.
Nodule characteristics also matter. The software might perform well when detecting larger nodules but struggle with smaller lesions, particularly those approaching its minimum detection size. Performance may also vary with low-dose CT protocols, reconstruction methods, or differences between hospitals.
Imagine the manufacturer discovers that nearly all 15 missed cases in its post-market sample involve small nodules that were underrepresented during validation. That would raise a different concern from 15 errors distributed randomly across different nodule types and sizes.
A single overall sensitivity score may hide a clinically important weakness. This is why manufacturers should establish not only overall performance thresholds but also appropriate subgroup monitoring based on clinical risk.
What happens at 85%?
Returning to our example, assume the manufacturer's PMS plan established observed sensitivity below 90% in a defined review population as a trigger for investigation.
The post-market result of 85/100 crosses that threshold. It does not automatically prove the AI is defective, require a recall, or justify immediate retraining. However, it does require the manufacturer to follow its predefined investigation process.
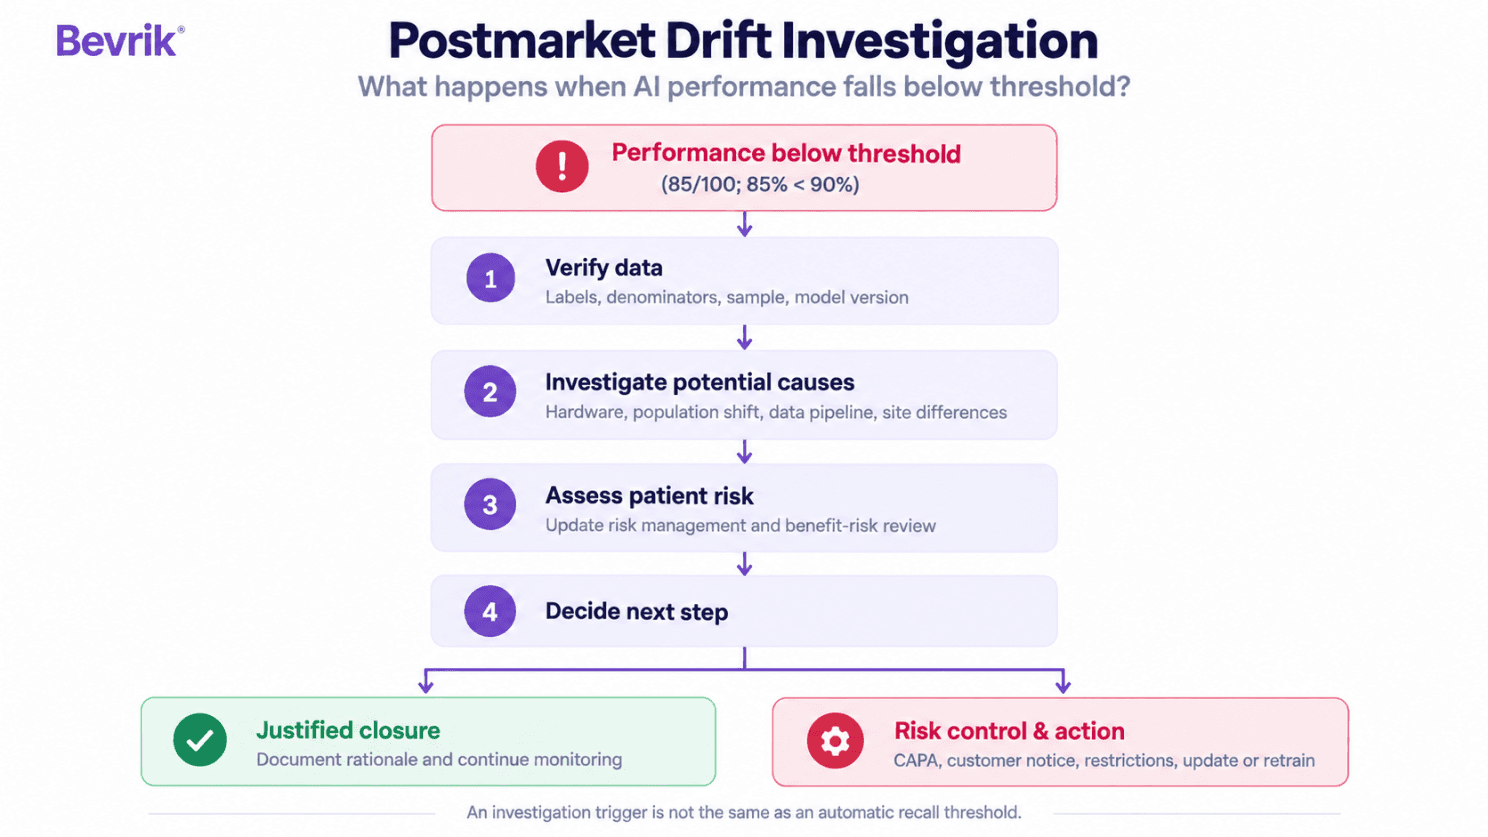
First, the manufacturer should verify the 100 confirmed cases, including the reference diagnoses, patient characteristics, scanner configurations, and deployed software versions. Next, the investigation should examine whether the decline is concentrated in one hospital, one CT protocol, or a particular nodule size.
Investigate potential causes along the data path. Suppose one hospital recently introduced a new low-dose CT protocol. The manufacturer discovers that most missed nodules came from scans using that protocol. Now the investigation has a plausible technical explanation that can be evaluated through additional testing.
The manufacturer must then assess whether the observed performance affects patient safety, whether existing risk controls remain effective, and whether changes are needed. Possible actions could include additional clinical validation, restricting certain imaging configurations, updating the IFU, initiating CAPA, or modifying the algorithm under the applicable regulatory change-control process.
Alternatively, the investigation may establish that incorrect reference labels or an unrepresentative sample explain the apparent decline. A documented, evidence-supported closure may then be appropriate.
Statistical uncertainty does not cancel a predefined investigation trigger. It helps determine what the results mean and which actions are justified.
Could your QMS pass the test?
manufacturer should be able to trace each performance threshold from intended use and clinical justification to its validation results, risk management file, PMS plan and documented response. The record should identify the exact software/model version, dataset, numerator, denominator, uncertainty, subgroup findings and final disposition.
Try a tabletop exercise: give Quality, Clinical and Engineering the hypothetical 85/100 pulmonary nodule detection result. Can they identify who opens the investigation, what evidence is needed, whether immediate measures may be necessary, and who approves closure?
Then ask one final question: What would you do if most of the missed nodules were found in one hospital or one clinically important patient subgroup?
If the response depends on unwritten assumptions between departments, the process may not be sufficiently defined.
The critical question is not whether your AI met its target before launch. It is what your organization does when the real world challenges that target.
References
- Regulation (EU) 2017/745, particularly Annex I Sections 1, 3 and 4; Annex III Section 1.1(b); and Annex XIV.
- MDCG 2025-10: Guidance on Post-Market Surveillance, including PMS indicators and threshold values.
- MDCG 2020-1: Clinical Evaluation of Medical Device Software.
- MEDDEV 2.7/1 Rev. 4: Clinical Evaluation.
- FDA: Predetermined Change Control Plans for AI-Enabled Device Software Functions, August 2025.
- FDA: Quality Management System Regulation (QMSR), effective February 2, 2026.
- ISO 14971:2019: Application of Risk Management to Medical Devices.
#MedicalDevices #MedicalAI #SaMD #ArtificialIntelligence #EUMDR #FDA #RegulatoryAffairs #ClinicalEvaluation #PostMarketSurveillance #PMCF #CAPA #RiskManagement #ISO14971 #AIGovernance #PatientSafety #Bevrik #PCCP
Originally published on LinkedIn.